Robustness choices recorded before estimation
The fixed question is whether teams classified as pro-immigration produce higher average marginal effect (AME) estimates than teams classified as anti-immigration. I will report the adjusted pro-minus-anti contrast from Table 1, column 3, and compare the same contrast under eight defensible alternatives. For the sensitivity exercise, I will call the direction stable if the contrast remains positive, and the inferential conclusion stable if its two-sided 95% confidence interval excludes zero. These choices and expectations were written before running the reproduction or robustness models.
| Alternative choice | Reason an analyst might choose it | Expected effect on the headline conclusion, before estimation |
|---|---|---|
| 1. Give each reported model equal weight instead of each team equal total weight. | Treat every submitted specification as evidence, irrespective of team. | May change it because teams submitted very different numbers of models. |
| 2. Omit all covariates and estimate the raw pro-minus-anti difference. | Describe the observed association without model-based adjustment. | May change it because ideology and team characteristics may covary. |
| 3. Keep skill, topic experience, and team size but omit discipline indicators. | Avoid many indicators with only 71 independent teams. | May change it if discipline strongly confounds the association. |
| 4. Add the team's prior belief about the hypothesis. | Account for a related pre-analysis attitude. | Unlikely to change it materially, based on the paper's own supplementary result. |
| 5. Winsorise the model-level AME at its pooled 1st and 99th percentiles. | Reduce the influence of extreme submitted estimates while retaining all models. | May change it if the tails drive the mean. |
| 6. Trim model-level AMEs outside those same pooled percentile cutoffs, then recalculate inverse model-count weights within teams. | Exclude the most extreme submitted estimates. | May change it for the same reason; the number of retained teams will be checked. |
| 7. Replace each team's mean AME with its median and regress the 71 team medians on the baseline covariates. | Describe a team's typical rather than average submitted finding. | May change it if a few within-team results drive team means. |
| 8. Refit the baseline after deleting each team in turn, and report the smallest pro-minus-anti contrast. | Check dependence on any single team, especially among nine anti-immigration teams. | May change it, particularly its confidence interval. The deletion rule is fixed here, before inspecting influence. |
Main result
I used the supplied data/df.dta and reproduced the nine key Table 1 estimates. The input has 1,253 usable model records from 71 teams: 9 anti-immigration, 31 moderate, and 31 pro-immigration teams. One extra .dta record has no team ID or AME and is excluded. Table 1 regressions give each team equal total weight and cluster standard errors by team. The negative and positive tail outcomes use the indicators already supplied in the dataset.
| Outcome | Ideology contrast | Published estimate (SE) | Reproduced estimate (SE) | Reproduced 95% CI | Published source |
|---|---|---|---|---|---|
| AME | Mean sentiment, per scale point | 0.011 (0.006) | 0.011 (0.006) | [0.000, 0.022] | Paper PDF, Table 1, col. 1 |
| AME | Pro minus anti team fraction | 0.074 (0.024) | 0.074 (0.024) | [0.025, 0.122] | Paper PDF, Table 1, col. 2 |
| AME | Pro minus anti team category | 0.085 (0.031) | 0.085 (0.031) | [0.023, 0.146] | Paper PDF, Table 1, col. 3 |
| Negative tail | Mean sentiment, per scale point | -0.051 (0.021) | -0.051 (0.021) | [-0.093, -0.010] | Paper PDF, Table 1, col. 4 |
| Negative tail | Pro minus anti team fraction | -0.242 (0.107) | -0.242 (0.107) | [-0.456, -0.027] | Paper PDF, Table 1, col. 5 |
| Negative tail | Pro minus anti team category | -0.274 (0.125) | -0.274 (0.125) | [-0.524, -0.024] | Paper PDF, Table 1, col. 6 |
| Positive tail | Mean sentiment, per scale point | 0.019 (0.012) | 0.019 (0.012) | [-0.004, 0.042] | Paper PDF, Table 1, col. 7 |
| Positive tail | Pro minus anti team fraction | 0.114 (0.045) | 0.114 (0.046) | [0.023, 0.206] | Paper PDF, Table 1, col. 8 |
| Positive tail | Pro minus anti team category | 0.087 (0.035) | 0.087 (0.035) | [0.018, 0.156] | Paper PDF, Table 1, col. 9 |
The AME category contrast is the headline comparison: pro-immigration teams have higher adjusted AMEs than anti-immigration teams. All nine point estimates agree with the paper at three decimal places. Eight of nine standard errors do too; for the positive-tail team-fraction contrast (column 8), the paper prints 0.045, while the package's code/Log Files/02_Main_Regs.log gives 0.0458145 and this calculation rounds to 0.046. The tail results are linear probability contrasts; a value of 0.087 represents 8.7 percentage points.
Robustness of the AME category contrast
| Analysis | Pro minus anti | SE | 95% CI | Two-sided p | Teams | Models |
|---|---|---|---|---|---|---|
| Published specification | 0.085 | 0.031 | [0.023, 0.146] | 0.008 | 71 | 1,253 |
| Equal model weight | 0.054 | 0.023 | [0.007, 0.101] | 0.024 | 71 | 1,253 |
| No covariates | 0.050 | 0.032 | [-0.014, 0.115] | 0.123 | 71 | 1,253 |
| No discipline indicators | 0.041 | 0.029 | [-0.017, 0.099] | 0.164 | 71 | 1,253 |
| Add prior belief | 0.084 | 0.031 | [0.021, 0.146] | 0.010 | 71 | 1,253 |
| Winsorised AME | 0.080 | 0.030 | [0.019, 0.141] | 0.011 | 71 | 1,253 |
| Trimmed AME | 0.078 | 0.031 | [0.017, 0.139] | 0.013 | 71 | 1,227 |
| Team median AME | 0.059 | 0.043 | [-0.027, 0.144] | 0.176 | 71 | 71 |
| Minimum leave-one-team-out | 0.052 | 0.015 | [0.021, 0.082] | 0.001 | 70 | 1,251 |
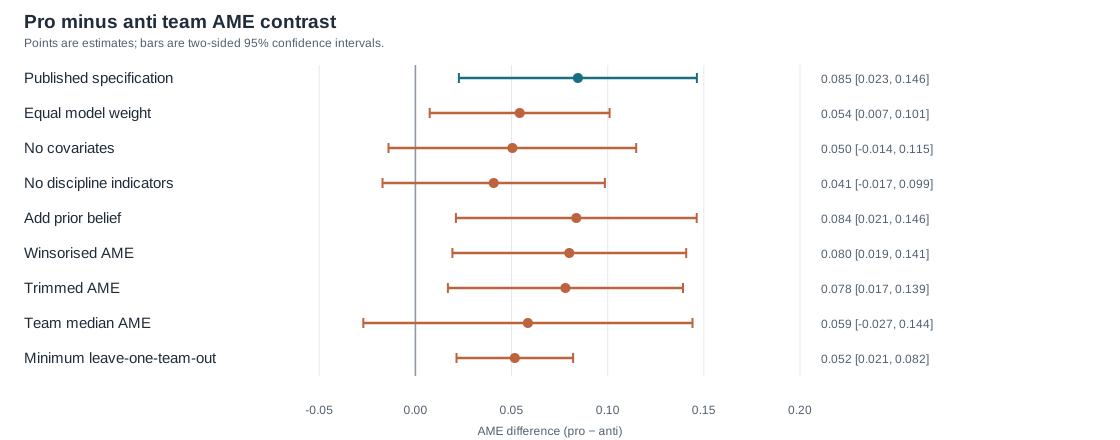
The pooled AME cutoffs for winsorisation and trimming are -0.544 and 0.580. Across all 71 single-team deletions, the contrast ranges from 0.052 to 0.101; 71 remain positive and 71 have 95% intervals above zero. The minimum occurs on deleting team 42 (anti-immigration). Each trimmed team's weight was recalculated as the inverse of its retained model count. The median analysis uses one record per team and HC3 standard errors; other rows use model-level weighted least squares and team-clustered standard errors.
Analysis decisions left open by the paper
I chose Table 1's AME category contrast as the numerical headline. The paper also emphasises the continuous ideology and tail outcomes, reproduced above.
I began with the package's prepared
df.dtarather than rebuilding it from the raw survey and model files. Thus, this reproduction accepts its team classification, skill and topic scores, discipline coding, and imputations. For the tail models, I used the package's existing indicators rather than reconstructing percentiles and significance tests.I excluded the record without a team ID or AME to match the paper's analysis sample. The supplied
nmodelmatches the actual number of model records per team.To implement the paper's weighted regressions in Python, I used weighted least squares, the lowest observed
mdegreecode as the categorical reference, a finite-sample cluster covariance correction, and t critical values with teams minus one degrees of freedom. The reference code affects individual discipline coefficients but not the reported ideology contrasts.I set a two-sided 95% interval as the threshold for the sensitivity conclusion and set the pooled, unweighted model-level 1st and 99th percentiles as the cutoffs for trimming and winsorisation. Within trimmed data I recalculated team weights. For team medians I used HC3 intervals.
The prespecified deletion diagnostic reports the smallest pro-minus-anti contrast across single-team removals; its p value is descriptive rather than a new confirmatory test.
Reproducibility and interpretation
Run python3 reproduce.py from a clean Python session with pandas, numpy, scipy, statsmodels, and pyreadstat installed, plus Pandoc for HTML conversion. The script reads only data/df.dta and writes report.md, report.html, and robustness.svg. The nine published numbers and standard errors in the comparison table are transcribed from the paper PDF; all reproduced and sensitivity estimates, intervals, p values, sample counts, cutoffs, and figure coordinates are computed by this script.
Conclusion
The adjusted pro-minus-anti AME difference reproduces the published result at its reported precision, and its direction stays positive in 9 of 9 specifications. The two-sided 95% interval excludes zero in 6 of 9 specifications (5 of eight alternatives), so the strength of evidence depends on reasonable analysis choices. These are observational associations across teams, with only nine anti-immigration teams, and do not by themselves establish that ideology caused the different estimates.