This plots distributions identified by find_possible_distributions using ggplot2.
They can be shown as histograms or as cumulative distributions (ECDF) plots. The latter give
more information, yet not all audiences are familiar with them.
plot_distributions(
  distributions,
  plot_type = c("auto", "histogram", "ecdf", "density"),
  max_plots = 100,
  show_ids = FALSE,
  facets = NULL
)
Arguments
- distributions
Tibble with a column
distributionand an identifier (id), typically as returned fromfind_possible_distributions.- plot_type
Plot multiple histograms, or overlapping cumulative distribution plots, or density plots? "auto" is to plot histograms if up to 9 distributions are passed, or if there are fewer than 10 discrete values, and empirical cumulative distribution plots otherwise
- max_plots
How many distributions should at most be plotted? If more are passed, this number is randomly selected.
- show_ids
Should ids of the distributions be shown with ecdf and density charts? Defaults to no, since the default ids are not meaningful.
- facets
Should distributions be shown in one chart or in multiple small charts? Only considered for ecdf and density charts, histograms are always shown in facets
Value
A ggplot2 object that can be styled with functions such as labs or theme_linedraw
Examples
sprite_parameters <- set_parameters(mean = 2.2, sd = 1.3, n_obs = 20,
min_val = 1, max_val = 5)
#> Warning: The sample size (* number of items) is too big compared to the precision of the reported mean. The GRIM test is only meaningful when N < 10 ^ precision (e.g. N < 100 for single-items means reported to two decimal places).
#> Warning: The sample size (* number of items) is too big compared to the precision of the reported mean. The GRIM test is only meaningful when N < 10 ^ precision (e.g. N < 100 for single-items means reported to two decimal places).
poss <- find_possible_distributions(sprite_parameters, 5, seed = 1234)
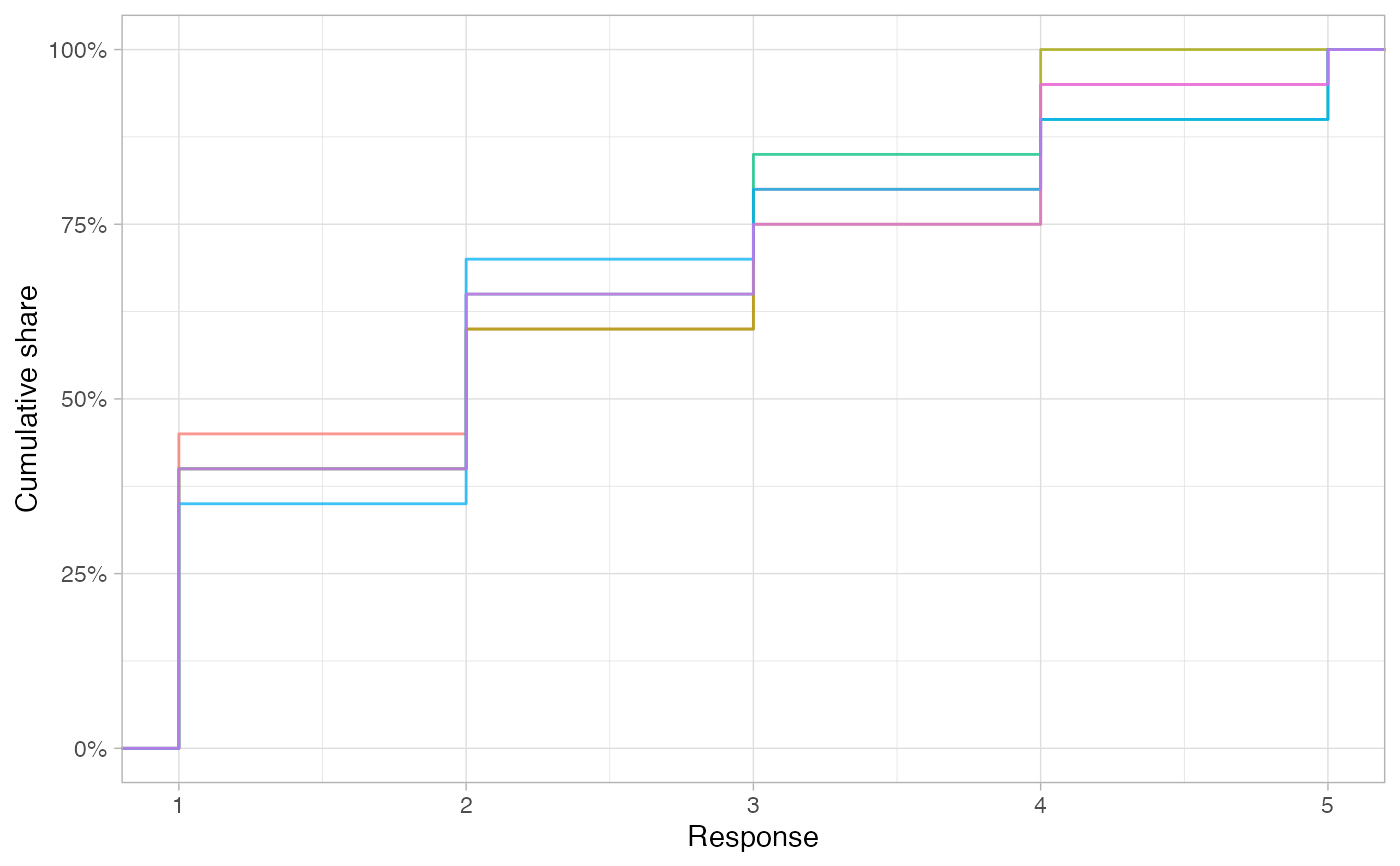
# All distributions in same plot
plot_distributions(poss, plot_type = "ecdf")
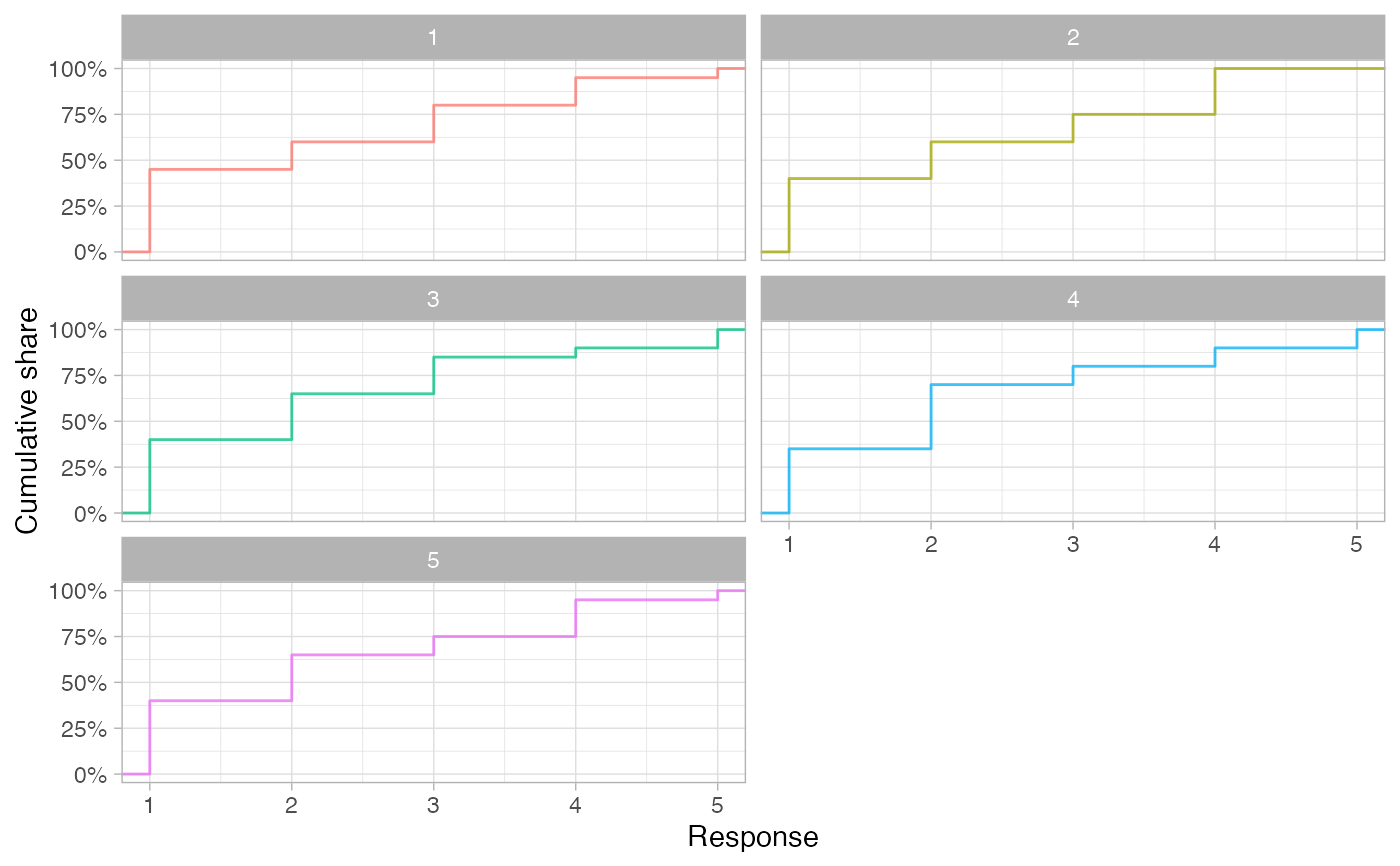
 # Separate plot for each distribution
plot_distributions(poss, plot_type = "ecdf", facets = TRUE)
# Separate plot for each distribution
plot_distributions(poss, plot_type = "ecdf", facets = TRUE)